Okay, so here we are. We have finally released the beta version of our Ruby application. Problem is, we added a bigger dataset to our beta and now, our app become too slow. Some user have been complaining about it. Even though we were keeping a careful eye on performance issues when we coded this app, bad surprises can still happen. Not so good algorithms, slow IO or architecture issues are some typical causes of performances problems.
There are many ways to find bottlenecks in programs. You may already be aware of what’s wrong but you could also have no clue where to look. Today, I’ll give advice that cover the « no clue » case.
In our quest to find out where a bottleneck could hide, Ruby provides classical but efficient weapons: profiling tools. Profiling is a runtime analysis that gathers information about memory usage, function calls, elapsed time in functions, etc. There are different methods to collect information from a running program:
Depending on what you are looking for, profiler outputs different results: calls graph, object allocation, etc.
Ruby have a built-in module called Profiler__ (source) that records function calls.
In order to use this profiler, you must run ruby with -r profile option that will require the profile.rb file (source).
If you look at the source codes then you will see how simple this profiler is (60 LOC).
It is an event-based profiler that uses the Kernel#set_trace_func method (doc) to trap all the function calls.
The output and the performance of this module isn’t satisfying.
I won’t, therefore, provide examples of how this profiler is used but if you’d like to know more, this resource covers in depth the profile.rb usage.
Ruby community provides a gem called ruby-prof. It’s a C extension and it outputs many different formats that made it faster and richer than profile.rb.
Prerequisites
To use the whole features of ruby-prof we need a patched version of Ruby interpreter. However it is not mandatory if you’re not using memory analysis.
To get a patched version of the Ruby MRI you can use RVM:
rvm install 1.9.3-p125 --patch gcdata --name gcdata
If you are not using RVM, compile a patched version of Ruby yourself. You can find the gcdata patch on RVM’s github.
There is a good step-by-step tutorial to do it here. I used the following steps with rbenv:
export DESTINATION=$HOME/.rbenv/versions/1.9.3-p125-gc
mkdir $DESTINATION
# Install lib yaml
cd /tmp
wget http://pyyaml.org/download/libyaml/yaml-0.1.4.tar.gz
tar xzf yaml-0.1.4.tar.gz
cd yaml-0.1.4
./configure --prefix=$DESTINATION
make && make install
# Install a patched Ruby version
cd /tmp
wget http://ftp.ruby-lang.org/pub/ruby/1.9/ruby-1.9.3-p125.tar.gz
tar xzf ruby-1.9.3-p125.tar.gz
cd ruby-1.9.3-p125
curl https://raw.github.com/wayneeseguin/rvm/master/patches/ruby/1.9.3/p125/gcdata.patch | patch -p1
export CPPFLAGS=-I$DESTINATION/include
export LDFLAGS=-L$DESTINATION/lib
./configure --prefix=$DESTINATION --with-opt-dir=$DESTINATION/lib --enable-shared
make && make install
rbenv global 1.9.3-p125-gc
# Install RubyGems
cd /tmp
wget http://rubyforge.org/frs/download.php/75952/rubygems-1.8.21.tgz
tar xzf rubygems-1.8.21.tgz
cd rubygems-1.8.21
ruby setup.rb
rbenv rehash
# Cleaning all sources and archives
rm -fr /tmp/yaml-0.1.4 /tmp/yaml-0.1.4.tar.gz /tmp/ruby-1.9.3-p125 /tmp/ruby-1.9.3-p125.tar.gz /tmp/rubygems-1.8.21.tgz /tmp/rubygems-1.8.21
You may want to install Graphviz, i.e. the open source reference for graph visualisation. It’s probably available via your package manager through something like:
(brew|aptitude) install graphviz
When you’ve got a patched Ruby VM, you can install ruby-prof with this classic command:
gem install ruby-prof
Once it’s installed you can run the following commands to profile a ruby program and get a nice PDF graph of its calls:
ruby-prof --mode=wall --printer=dot --file=output.dot fibonacci.rb 25
dot -T pdf -o output.pdf output.dot
your_favorite_pdf_reader output.pdf
In this example, I used a naive fibonacci.rb program found here:
# fibonacci.rb
def fib(n)
  return n if (0..1).include? n
  fib(n-1) + fib(n-2) if n > 1
end
puts fib(ARGV[0].to_i)
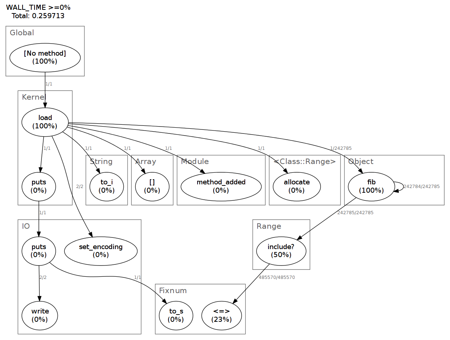
The output look like this:  on my machine.
As you can see, there are obvious optimizations in this example. The call graph shows that 50% of time is used to do the
 (0..1).include?(n)…
Sampling profilers give an advantage over event-based profilers like ruby-prof: it can be used in a production environment without changing anything in your configuration and with a small overhead. Perftools.rb is one of them. To install it use:
gem install perftools.rb
Be aware that the perftools.rb compilation will take a while.
Then, to run fibonacci.rb, let’s add some environment variables before calling the program:
CPUPROFILE=/tmp/output.prof \
CPUPROFILE_REALTIME=1 \
CPUPROFILE_FREQUENCY=1000 \
RUBYOPT="-r`gem which perftools | tail -1`" \
ruby fibonacci.rb
The output of such a command leads to a file (/tmp/output.prof) containing the captured data. A readable representation can be built with the command pprof.rbthat is provided with the perftools.rb gem:
pprof.rb --pdf /tmp/output.prof > /tmp/output.pdf
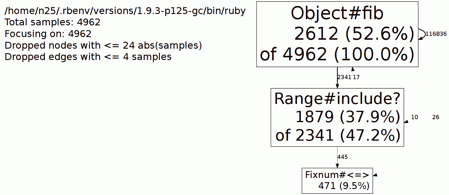
The result of such a command looks like this: 
The major drawback of using a sampling method is that we only see what happen when the profiler interrupts the program.
Using perftools.rb inside a Rails app is easy since there is a Rack based middleware: Rack::PerftoolsProfiler.
Benchmarking can be an additional method to find bottlenecks but it is not really its purpose. We usually perform benchmarking to get metrics about the execution of a piece of code.
The standard library provides the Benckmark module that can be used like that:
def fib(n)
  return n if 1 >= n
  fib(n-1) + fib(n-2) if n > 1
end

def fib_include(n)
  return n if (0..1).include? n
  fib_include(n-1) + fib_include(n-2) if n > 1
end

require 'benchmark'

n = ARGV[0].to_i
Benchmark.bm(8) do |x|
  x.report("1 >= n")  { fib n }
  x.report("include") { fib_include n }
end
➜ ruby fibonacci.rb 35
               user     system      total        real
1 >= n     2.180000   0.000000   2.180000 (  2.184407)
include    5.190000   0.000000   5.190000 (  5.189968)
This really good guide: Performance Testing Rails Applications remains the reference regarding profiling and benchmarking. In Rails’ latest versions, the benchmarking tools were moved to ActiveSupport::Benchmarkable the previous link isn’t up to date. Among the goodies that come with Rails 3, there is the new ActiveSupport’s notification system (doc). This system comes with a handy logging tool based on LogSubscriber. This allows you to easily instrument your code.
As I’ve previously said there is also a middleware for perftools.rb Rack::PerftoolsProfiler.
In this article, we’ve barely scratched the surface of different tools that can guide us into performance refactoring of our code. In the next article we will see a few solutions to improve ruby code performance (using C code, caching, hashing, etc).
The Synbioz Team.
Nos conseils et ressources pour vos développements produit.